


A decade ago, many CoEs/GCCs were set up with a simple job: build capacity. Hire engineers, deliver roadmaps, keep costs predictable. But that world is gone.
Today, CoEs carry real product responsibility. They own platforms, ship releases, run AI programs, and sit closer to customer experience.
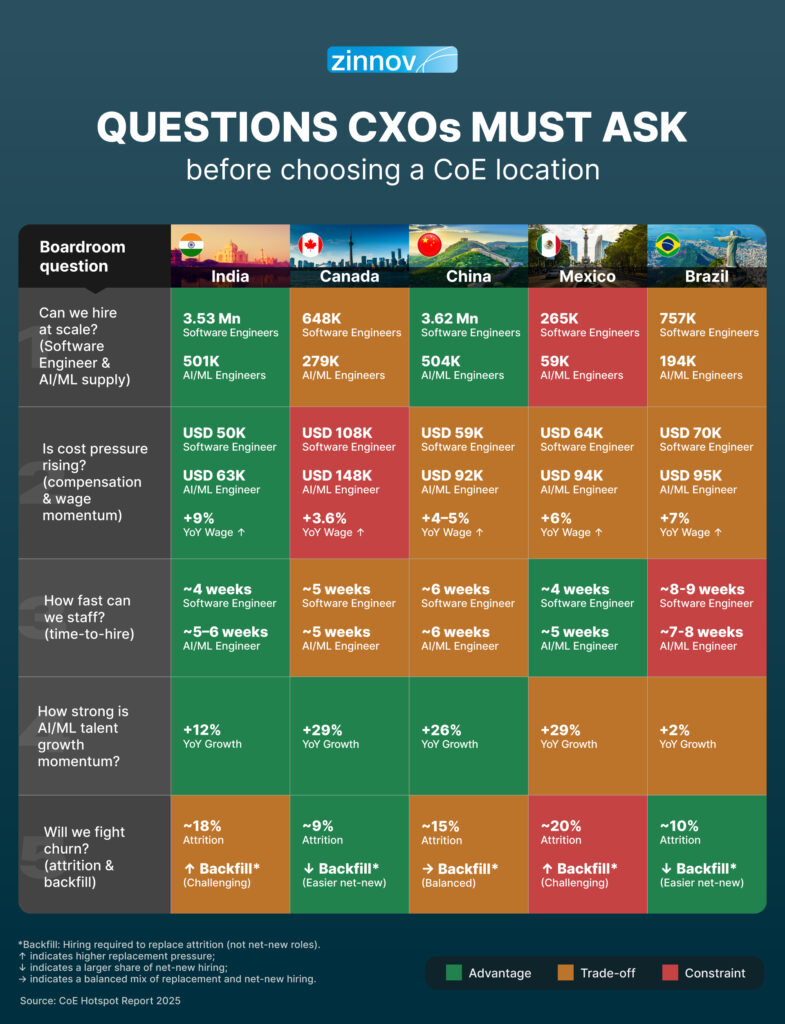
Talent and cost still start the conversation, but they no longer finish it. Over the last few years, leaders have added a second layer of questions, because these are the ones that decide whether the plan holds once the center starts hiring and shipping.
With these questions as our lens, we compared Zinnov’s CoE Hotspots of the World reports across 2023, 2024, and 2025 and applied the same filter consistently. That three-year read is what tightens the 2026 shortlist to 5 countries, and explains the “why” behind each of them.
India stays the reference point for one reason: it can take a real ramp plan without breaking either supply or economics.
The talent base in India is simply hard to match, ~3.53 Mn Software Engineers and ~501K AI/ML engineers. In business terms, that scale gives you options: multiple cities, multiple talent pockets, and the ability to build beyond a 100-person pilot into a multi-team center without immediately running into a hard ceiling.
Two implications follow. First, AI costs more, about a ~25% premium, so an AI-heavy Center of Excellence (COE) / Global Capability Center (GCC) needs a different budget baseline than a classic engineering Centers of Excellence (CoE). Second, the bigger change is that cost is not static. If you build a three-year plan on “today’s salary,” you will end up reopening the budget. India rewards teams that bake inflation headroom into the business case from day one and make city choices deliberately, instead of treating the country like a single uniform market.
India’s advantage is speed. Zinnov’s time-to-hire signals show roughly ~4 weeks for software engineers and ~5–6 weeks for AI/ML. That’s why India keeps winning when leaders need momentum: you can staff pods quickly enough to protect delivery dates.
But the same speed can turn into churn if you don’t design the employee experience early as attrition sits at ~18%. Translate that into operating reality: in a 100-person team, you should expect meaningful turnover within the year unless you actively manage it. That means backfill capacity, stronger people leadership, visible career paths, learning investments, and internal mobility mechanisms are not “nice to have,” they are part of the India operating model.
Contractor preference is low (~7%), which supports employee-heavy builds and sustained ownership, especially important when the Centers of Excellence (CoE) owns platforms and long-lived systems. On the external environment, the effective corporate tax band is shown at ~26–38%, which matters for net-cost modeling at scale. And time zones are the practical constraint: India runs smoothly for Europe and distributed global teams; North America-heavy product orgs need deliberate overlap design, leadership presence, rotating pods, or follow-the-sun execution, so decisions don’t slow down.
Put together, India is the clearest choice when your charter is engineering-heavy throughput or AI delivery at volume, and you want a center that can grow without constant reinvention.
Strong domains: Zinnov’s markers highlight Software & Internet, Automotive, Telecommunications.
So what for 2026: India remains the anchor for predictable throughput, and the teams that succeed treat retention and leadership bench-building as part of the initial investment, not a clean-up job.
Canada enters the shortlist when the mandate is clear: build serious AI capability and keep the operating rhythm close to North America. Leaders don’t go to Canada expecting a cost win. They go because they want a deeper senior bench, tighter collaboration with US product teams, and less friction in day-to-day execution.
For 3–6 years’ experience, software salaries average ~USD 108.2K (+3.6% YoY) and AI/ML averages ~USD 148.1K (+3.6% YoY), with an AI premium of ~37%.
Two implications follow. First, Canada is a high-baseline market, so it works best when the work is high-leverage, AI product engineering, applied ML, data science leadership, platform/security, where quality and speed matter more than wage arbitrage. Second, wage movement is relatively steady. That doesn’t make Canada “affordable,” but it does make planning cleaner: you’re less likely to see the business case swing wildly due to inflation surprises.
Hiring velocity is also predictable. Time-to-hire sits around ~5 weeks for both Software and AI/ML. What Canada really buys you is what happens after you’ve hired: overlap hours. When product leadership sits in the US, Canada reduces coordination delay as a default. Fewer handoffs get pushed by a day. Decisions close faster. Iterations tighten. That cadence advantage is hard to quantify in a spreadsheet, but most leaders feel it immediately once teams start shipping.
Canada’s attrition is at ~9%, among the lowest in the set. Translate that into operating reality: you spend less time replacing people, fewer teams get disrupted mid-project, and the organization keeps more institutional knowledge, exactly what you need when the CoE owns platforms and long-lived AI systems.
The employment model supports continuity too. Contractor preference is moderate at ~11%, enough flexibility to scale selectively, without forcing a contractor-heavy structure. On the policy side, effective corporate taxation is shown as ~36-42% (28% federal + ~8–14% provincial), which makes province selection and incentives meaningful in net-cost design. Currency exposure is real: when salaries are high, CAD swings show up quickly in USD budgets, so finance teams tend to ask for FX scenarios early.
Put together, Canada works best when the CoE is designed as a capability hub: senior-heavy, product-aligned, and close to decision-makers.
Strong domains: Software & Internet, Telecommunications, Semiconductor
So what for 2026: Canada belongs in the 5 when capability and cadence matter more than labor arbitrage, especially for AI product engineering and leadership-heavy builds.
China stays on the shortlist because it combines two things that are rare together: scale and AI depth.
As of FY2024, China carries ~3.62 Mn software engineers and ~504K AI/ML engineers, with AI/ML growing ~26% YoY. In practical terms, that means you’re not building an AI team on the margins, you can build meaningful pods and keep scaling without immediately hitting a ceiling.
The leadership debate on China is usually not “can we hire?” It’s “can we run the model the way we need to run it?” Because the differentiator here is not availability, it’s the operating environment and how the hub fits into global execution.
What that means is simple: if your charter is AI-heavy, you need to budget for a higher AI baseline and be clear about which AI roles you’re hiring locally, core ML engineering, applied ML, MLOps, data science, because the market prices that talent aggressively.
Hiring speed is also very steady and predictable. Time-to-hire clusters around ~6 weeks for both software and AI/ML. That’s not the fastest ramp lever in this shortlist, but it is consistent enough for planning, especially for organizations that prefer predictable staffing cycles over rapid “burst hiring.”
On stability, China sits in the middle: attrition is ~15%, and contractor preference is relatively low at ~8%. That combination often supports employee-led builds for long-lived ownership, useful when the Centers of Excellence (CoE) owns platforms, core systems, or sustained AI programs that can’t afford churn in accountability.
Policy and tax are part of the equation. Effective corporate tax is shown at ~25%, but the bigger leadership question tends to be broader than tax: regulatory comfort, data and security posture, and how the work is partitioned in a multi-hub design. China works best when those decisions are made early, not deferred.
Currency and time-zone fit are practical considerations. CNY (Chinese Yuan Renminbi) exposure should be modeled over the planning horizon. Time-zone fit depends on where leadership and product sit: China aligns naturally with APAC-heavy operating models; Western-heavy organizations need a deliberate cadence design so decision cycles don’t stretch.
Put together, China is a high-capacity option for organizations that can run an APAC-aligned model and want depth in engineering and AI at meaningful scale.
Strong domains: Automotive, Software & Internet, Industrial
So what for 2026: China remains a serious scale-and-capability option, and the companies that succeed are explicit about the operating constraints and how the hub fits into a multi-hub design.
Mexico has climbed the shortlist because leaders started treating time zones as an execution variable. When your product leaders sit in the US, the difference between “same-day collaboration” and “next-day handoffs” shows up everywhere, planning, incident response, sprint velocity, stakeholder alignment. Mexico is the nearshore option that changes that cadence without forcing a US-level cost base.
The talent pool is not India or China-scale, but it’s growing quickly in the directions companies care about. In 2024, Mexico has ~265K software engineers (+15% YoY) and ~59K AI/ML engineers (+29% YoY). The growth rate is the signal: the AI pipeline is expanding, which matters when your CoE charter includes AI-adjacent engineering roles, data engineering, ML engineering, MLOps, and a focused layer of data science leadership.
Mexico’s advantage is ramp speed. Time-to-hire is around ~4 weeks for software and ~5 weeks for AI/ML, fast enough to build real pods without long lead times. But the retention story needs equal attention. Attrition is shown at ~20%. In operating terms, that means you should expect higher backfill load if you ramp aggressively, and you’ll need employer brand, manager capability, growth paths, and role clarity early, especially in the cities where competition is concentrated.
The employment model is another defining factor. Contractor preference is high at ~35%. That can help you scale faster, but it also increases the governance requirement: clear boundaries on what work can be contractor-heavy, strong vendor management, and tighter IP and continuity controls for platform and product-critical work.
On the external environment, effective corporate tax is shown at ~30%, and MXN exposure can move USD costs over time, Mexico business cases hold up best when teams model FX scenarios rather than treating currency as background noise.
Put together, Mexico is less about affordable labor and more about operational speed: a location that keeps product teams in sync with North America and reduces the coordination overhead that quietly slows execution.
Best fit: US-aligned product engineering pods, platform teams that need daily overlap, and domain-heavy engineering tied to regulated and manufacturing ecosystems.
Strong domains: Automotive, Medical Devices, FMCG
So what for 2026: Mexico is the nearshore acceleration lane, and the business case holds when companies budget for retention and treat contractor governance as real work.
Brazil offers something few markets in the region can: real scale.
The talent base currently sits at ~757K Software Engineers and ~194K AI/ML engineers, large enough to support substantial footprints rather than small satellites. Growth is slower than the fastest-moving markets, but the base is meaningful, and that’s what matters when you’re building for continuity over multiple years.
Brazil’s defining feature is the employment model. Contractor share is shown at ~66%, the highest in this shortlist. That number changes how you run the center. Contractor-led markets can scale through flexible models, but they raise the governance bar: clear ownership boundaries, strong vendor management, tighter IP controls, and continuity planning so knowledge doesn’t walk out with rotating teams. The companies that succeed in Brazil treat governance as part of delivery.
Time-to-hire is longer: ~8–9 weeks for Software and ~7–8 weeks for AI/ML. The practical implication is simple: Brazil can support scale, but it typically needs more runway. If your ramp plan assumes “we’ll hire in a month,” Brazil is not for you. If your plan assumes a longer lead time and you build the pipeline accordingly, it can deliver stable capacity.
Retention is a positive signal once teams are built. Attrition is shown at ~10%, which can support stability and long-term ownership, particularly when the center is structured to keep core knowledge in-house and use contractors selectively rather than indiscriminately.
On net cost, effective corporate tax is shown at ~15%, among the lower snapshots in the COE Hotspots report. Currency exposure matters: BRL volatility can move USD costs materially, so finance teams should model FX scenarios early instead of treating currency as background noise. Time-zone fit is also an advantage for Americas coverage, Brazil can work well for parts of North America and is naturally aligned for LATAM-focused delivery.
Put together, Brazil is a strong option when your goal is Americas scale and you’re willing to run a contractor-led model with proper controls and realistic hiring timelines.
Strong domains: Automotive, Software & Internet, FMCG
So what for 2026: Brazil belongs in the eight as a scale option in the Americas, with a clear operating stance on contractors, governance, and ramp timing.
COEs don’t win because they’re built in the right country. They win because they’re built to run well.
These six locations keep surviving the filter because they can support real charters at real scale, if you plan honestly. The numbers tell you where the upside is, and they also tell you where the risk sits: wage trajectory, attrition, contractor reliance, tax and FX exposure, and time-zone friction.
So make the decision the way strong operators do: match the center you’re building to the market you’re entering. Use the nine questions before you fall in love with a rank. Then design the operating model, hiring engine, retention, governance, and cadence, like it’s part of the location choice.
That’s how you make a COE decision in 2026 that still looks smart in 2028.
Want the full picture? Explore Zinnov’s COE Hotspots of the World report for a comparative view of 25+ countries, with talent depth, cost curves, AI readiness, policy shifts, and execution risk, so you see not just where to go, but why it holds up over time. Download here.